Statistics
This page is designed to help solidify the following enduring understandings:
- Distinguish the purposes of descriptive statistics and inferential statistics
- Apply basic descriptive statistical concepts, including interpreting and constructing graphs and calculating simple statistics (e.g., measures of central tendency, standard deviation)
Descriptive and Inferential Statistics
Let's talk statistics!
Descriptive statistics are representations of what we know. This is a good way to get a picture of a large amount of data by putting it into quantitative categories. For example:
54 men and 46 women participated in study X. The total number of participants was 100.
In this case, the above statistics describe the gender of the participants, the number of participants in a given category, and the total number of participants overall. Note that the definitions of men and women are not stated. These would be operational definitions.
Inferential statistics are predictions we can make based on observed differences between groups in a study that we are reasonably confident are not due to chance. For example:
Based on our experiment, we expect men to be twice as likely as women to engage in behavior Y.
What makes this inferential is the expectation of future behavior. If we said instead that men in our study were twice as likely to engage in behavior Y, that would be based on existing data (past events) and therefore be descriptive.
Measures of Central Tendency |
Measures of Spread |
|
The Mean
The mean, also referred to as the average, is the measure of central tendency with which people are most familiar. The mean is calculated by taking the sum of values in a group and dividing it by the total number of items. For example: Five students took the make-up exam. Their scores were 95, 91, 88, 83, and 72. To get the mean, we first add all the values, then divide by 5, the number of scores. (95+91+88+83+72)/5= 429/5= 85.8 The mean of this set of scores is 85.8. The Median The median is the middle value of a set of numbers. If we have an even number of values, we take the average of those two values to get the median. Let's look at the above example again. Five students took the make-up exam. Their scores were 95, 91, 88, 83, and 72. In this instance, we simply take the middle value. Our median is 88. Let's look at a different example, however, that shows how the median can be a more useful measure: Six homes in the neighborhood sold in the past month. The sale prices were: $450,000, $600,000, $800,000, $850,000, $925,000, and $3,200,000. The median in this example is the average of our middle two values: (800,000+850,000)/2 = 825,000. In this example we have a fairly widely spread series of values - something we can account for using measures of spread (see the next column). Especially notable is our value of $3,200,000 - which is an outlier. We call it an outlier because the value is noticeably removed from other data values. In this case, the median as a measure of central tendency is the more representative number. The mean ($1,137,500) is not as representative of this data set. The Mode The mode is the most commonly occurring value of a set of numbers. |
Range
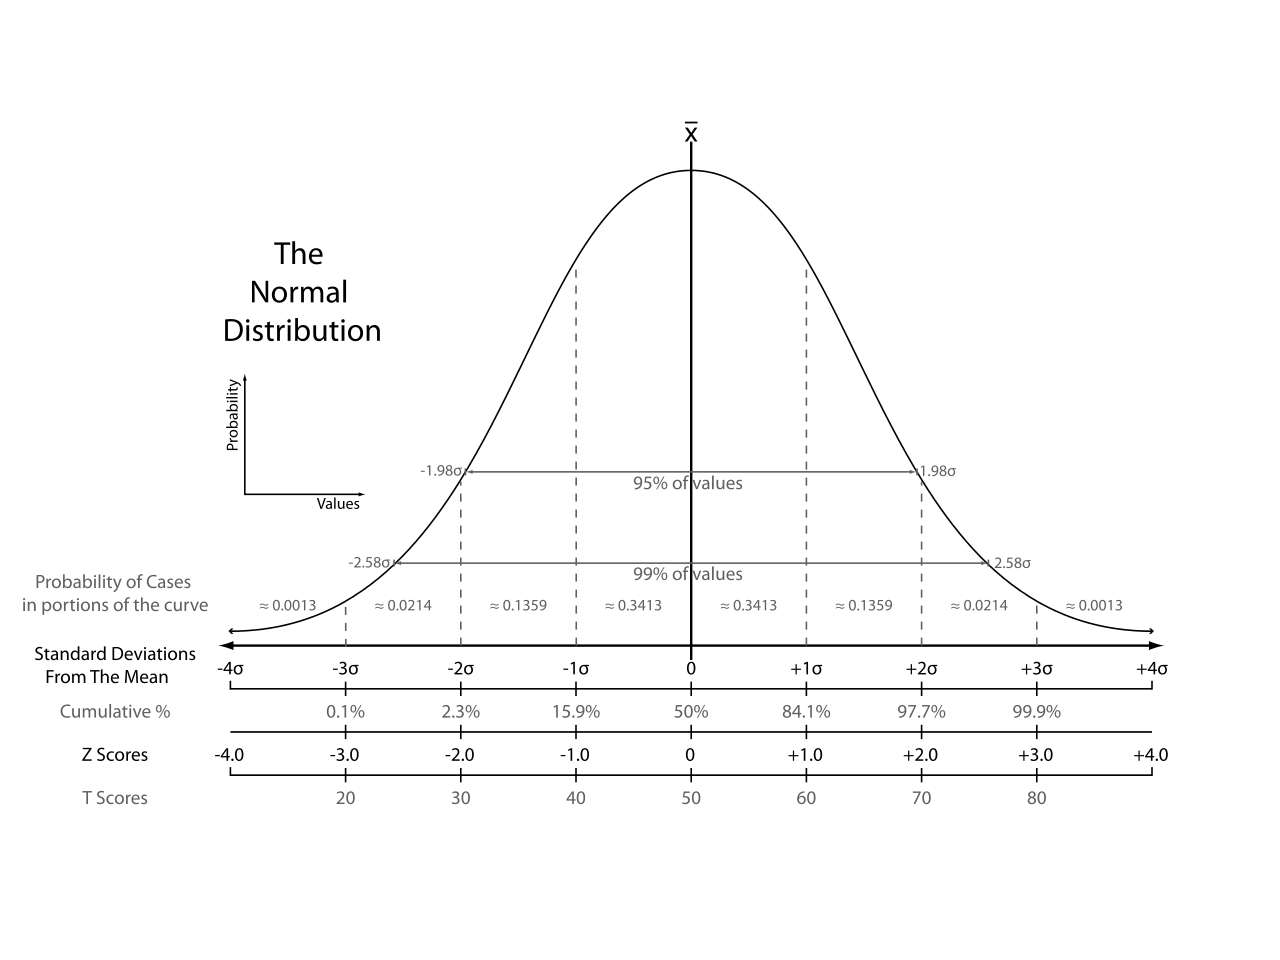
The range of a set of values is the difference between the highest and lowest value in the set. For example, in the set of values 1, 4, 7, 11, 16; the range is 16-1=15. Standard Deviation The standard deviation is a measure of the dispersion of data in a set. The larger the standard deviation, the more data in a set varies. Conversely, the smaller the standard deviation, the less data in a set varies. This video explains standard deviation and the normal curve: It's a bird! It's a PLANE! Nope. Just a normal curve. |

